Predicting Hospital Bed Availability (Part. 2)
In this post, Thibault Duplay and I present you our second Post of a Medium Serie about our summer intership at NYU Langone Health - Originally published on Medium
Feel free to leave Comments and Claps!

We are Selim Amrouni and Thibault Duplay, current students in Operations Research at Columbia University. Feel free to contact us by email (Selim/Thibault) or on our LinkedIn (Selim Amrouni/Thibault Duplay) accounts if you have any question.
In this Medium series, we will present our work as Research Interns this Summer 2018 at NYU Langone Health.
Part. 1 was about the general presentation of the problem and a description of the hospital processes.
This article (Part. 2) will be focused on the model used for predicting the hospital occupancy. So, here we go into the core of the project!
Inpatients Model
Preliminary
Inpatients are already into NYU Langone premises. As they are already admitted, the unique goal is to predict their discharge date. Then, by summing the discharges within each NU, we can retrieve the number of patients within the NU.
Predict every day what is the remaining LoS of the patient
Two approaches can be implemented to predict the discharges of the patients. First, we can try to forecast directly the patient LoS at the moment of the admission (example: 3 days, 4 days…). However, the discharge of the patient is very unpredictable and the estimated discharge date changes several times during the patient care process. Indeed, the patient’s body reactions are uncertain and nobody knows exactly how long the patient will stay, what will be the future treatments, etc… So, a second approach is to predict every day what is the remaining LoS of the patient. This is the approach we adopted.
Also, predicting the discharge date can be seen both as a regression or a classification problem.
Due to the granularity required by the CTC team, we opted for a classification approach.
In the regression problem, the goal is to predict the right amount of time remaining in the hospital. However, due to the granularity required by the CTC team, we opted for a classification approach. Indeed, for an operational point of view, the importance is to know every day the occupancy of the hospital but they do not care about the exact time of the discharge. After several reviews with the team, in addition to the day, we realized that an important information to know for them is if the discharge will happen before noon (12:00 PM). Indeed, knowing if a bed is a Discharge Before Noon **(DBN) enables the team to directly re-attributes this bed during the afternoon. Then, there is no under-occupancy of the bed which will host of the patient during the night. That is why we turned the regression problem to a classification one. We **split the time into seven twelve-hours slots going from** “0–12h”** to “+72h”. For example, if a patient belongs to the class “24–36h”, it means his remaining LoS is between 24 and 36 hours. So, the problem of predicting the number of inpatients in the hospital is turned into a supervised seven classes classification problem.
Features used
The dataset used for this task is the Current Census. It is the snapshot view of the hospital with about two hundreds of features. However, due to a data leak of future data in the past data (the past data of a patient are overwritten by the last entries), we were not able to use these features. Hopefully, after several meetings with the I.T. team and thanks to their amazing work, we started the capture and storage of this Current Census dataset four times a day. Thus, we hope we will be able to try and test our methodology in future work.
At first glance, because we don’t have access to historical data, we were only able to use one feature for our inpatients model: the estimated discharge data given by the physician. Indeed, the physician during its daily patient tour updates the estimated discharge date of the patient.
Processing of the data
Given the estimated discharge date by the physician and the current time, we can compute the remaining Length of Stay of the patient. Then, knowing the remaining amount of time the patient will stay, we can attribute each patient to the category it belongs. The last step is counting, within each NU, the number of patients belonging to each category in order to know the number of discharges.
Results
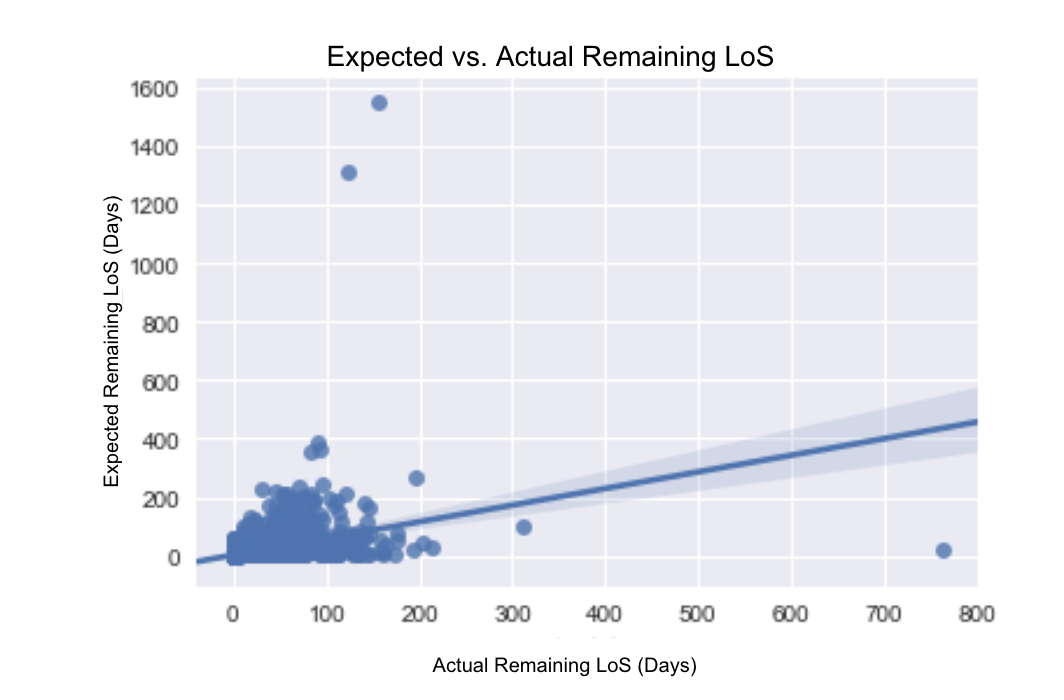 Scatter Plot of the Actual vs. Expected Remaining LoS
This scatters plot of the Actual Remaining LoS vs. Expected Remaining LoS demonstrates the inefficiency of the physician prediction. Based on this observation, we tried to develop a supervised learning classification algorithm.
Scheduled Model
Placement Matrix
The Placement Matrix assigns a type of medicine and a level of care to a NU.
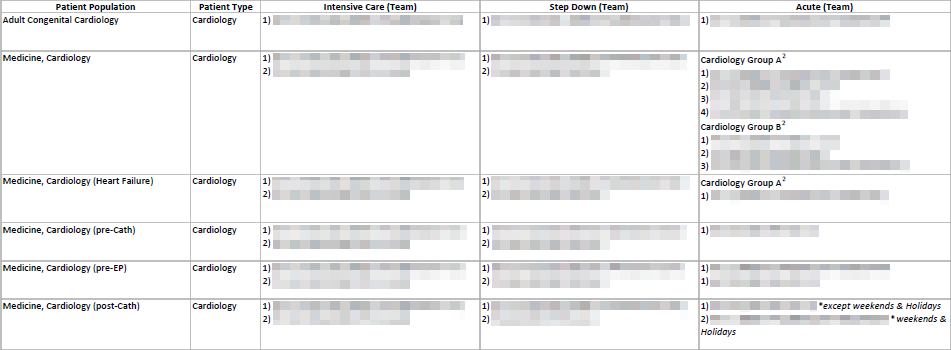 First rows of the Placement Matrix (details have been blurred for non-disclosure
agreement)
We can see that in some cases there are listings of NU ( 1), 2) … ). This describes an order of NU filling, if “1)” is full then put the patient in “2)” and so on. We can also observe that sometimes depending on the team of surgeons or the type of the day (weekdays, weekends or holidays) the placement can change.
We had to interpret raw texts…
The format is not thought to be used by machines but by the human employees. We had to interpret raw texts. Sometimes the names of the NU differ a bit for the same NU. We needed to find a method that dealt with these difficulties, we could not code a simple mapping for that particular Placement Matrix. Indeed the Placement Matrix is often changing, we needed to perform an algorithm robust to these changes.
…using a word distance…lowest number of elementary operations on ch1 needed to transform it into ch2
We decided to make a list of unchanged names of NU, then using a word distance we associated the NU suggested by the Placement Matrix to the one that minimizes the distance in our list. For this purpose, we used the following distance: Let ch1 and ch2 be two chains of characters. The distance between ch1 and ch2 noted D(ch1, ch2) is the lowest number of elementary operations on ch1 needed to transform it into ch2. There are three elementary operations:
- Interchanging two characters (1) (ex: dog → god)
- Inserting a character (2) (ex: god → gold)
- Removing a character (3) (ex: gold → old)
For example D(“dog”, “glove”)= 5:
 How to calculate the distance between ”dog” and “glove”
This distance has been inspired from the famous Levenshtein Distance. We added the operation “interchanging”. In our case, the chains of characters are in fact sentences. The interchanging allows flexibility if words are similar but not in the same order in the two sentences. We can notice that the distance verifies the widest mathematical definition of a distance:
 Definition of a distance
The results were really satisfying, none of the NU names were wrongly mapped.
Admissions
The admission was straightforward once we have been able to handle the Placement Matrix correctly. We chose the hypothesis that the patient enters his NU in the time slot following the one of his surgery. We did this choice in order to take into account the length of the surgery and the time spent in the PACU. For example, if a patient is scheduled for tomorrow afternoon, therefore in the slot “36–48h”, we will assume that he will arrive at his NU in the time slot “48–60h”.
Discharges
Since we do not have yet any other information on the patient (he is not in the
hospital yet), we cannot affect him with a satisfactory accuracy a LoS.
According to his NU, we can sample its LoS based on the historical
data.
The next figure gives us the average LoS of the patients for each
unit:
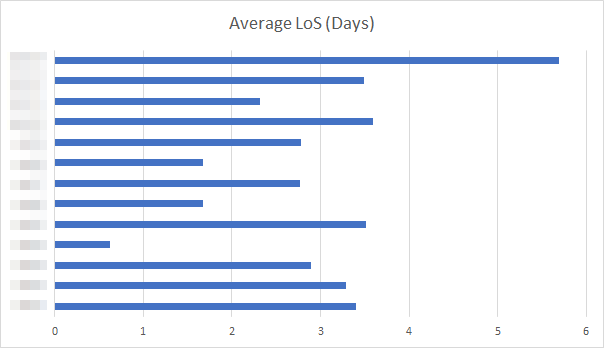 The average LoS for each unit (details have been blurred for non-disclosure
agreement)
Unscheduled Model
For the unscheduled patients, we needed to sample the arrivals in the Emergency Room using the historical data.
Admissions
The principle is simple, in the data about patients’ discharges we can derive the average number of arrivals per day, taking in account day-of-the-week-seasonality. The figure below gives the precision about this particular seasonality. The seasonality due to the period of the year (there are some peaks, especially during the summer or the winter) is supposed to be directly taken into account. Indeed we considered only the 2 last months of discharges data. Therefore the statistics made consider only the current period of the year.
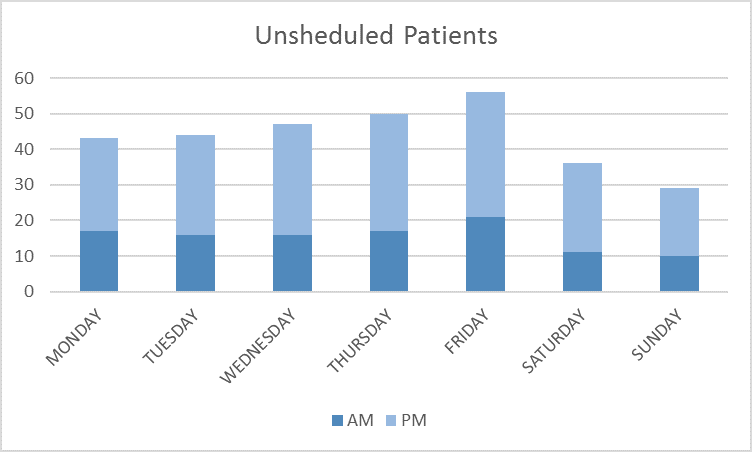 Day-of-the-week-seasonality for the unscheduled arrivals
We need to simulate today, tomorrow and after tomorrow
Once we made statistics on the days, we know how many unscheduled patients we
need to simulate today, tomorrow and after tomorrow. We are even more precise:
we take into account whether it is the morning or the afternoon to fill our time
slots correctly.
Then, if we know we have to sample “n” unscheduled
arrivals in a particular time slot, we can also assign to this “n”
different patients an NU. We did this assignment using the historical data, the
next figure is illustrating the share of the NU for the unscheduled arrivals.
Based on this distribution we can easily sample our unscheduled patients (it is
just a Multinomial Distribution). We used this model to fill our inputs for the
Emergency Room arrivals.
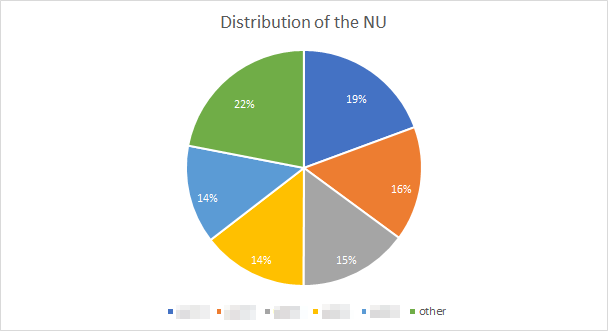 The distribution of the NU concerning the unscheduled arrivals (details have
been blurred for non-disclosure agreement)
Discharges
As we did for the scheduled we sample the LoS of the unscheduled patients. Then we can derive the discharges dates of the unscheduled arrivals.
Now the CTC team has its software all set…
 Graphic interface we made in order to facilitate the use for non-technical
people
Conclusion
Et voila! In this second part, you had the opportunity to deep dive into the model we build for the project. In the coming articles, we will get into fancier and more attractive mathematics to improve the model.
Please, follow us and stay tuned….