Predicting Hospital Bed Availability (Part. 1)
In this post, Thibault Duplay and I present you our first Post of a Medium Serie about our summer intership at NYU Langone Health - Originally published on Medium
Feel free to leave Comments and Claps!

We are Selim Amrouni and Thibault Duplay, current students in Operations Research at Columbia University. Feel free to contact us by email (Selim/Thibault) or on our LinkedIn (Selim Amrouni/Thibault Duplay) accounts if you have any question.
In this Medium series, we will present our work as Research Interns this Summer 2018 at NYU Langone Health.
This article (Part. 1) will be focused on the general presentation of the problem and a description of the hospital processes.
Part. 2 will be focused on the model used for predicting the hospital occupancy. So, here we go into the core of the project!
Internship Overview
“ Predict the hospital bed availability in the next 72 hours…”
Capacity Planning, the prediction, and optimization of bed occupancy in a hospital is a popular field. The goal is to enhance the operation process and improve efficiency in the health-care industry. Several hospitals, such as Cincinnati Children’s Hospital and Yale New Haven Hospital, have already improved their operation system thanks to the Capacity Planning.
As a hospital in a major city of the world, New York, NYULMC experienced several shortages of beds (saturation of the bed availability). These situations are extremely annoying that is why predicting in advance the bed occupancy and then using these predictions to optimize the patient placement is an interesting and useful problem.
Our goal has been to predict the bed availability in the next 72 hours
(for each day).
The model must be** re-calibrated** as the data arrives: we
do not know what will happen today, but tomorrow we will know everything about
what happened, so the model has to constantly re-fit its prediction with the
updated data.
Comprehensive Transfer Center

“white airplane in sky above body of water” by kazuend on Unsplash
“Hospital Control Tower”
The Comprehensive Transfer Center (CTC) is a dozen-members-team which
manages all patient-flow activities throughout NYU Langone Health. It
manages transfers into and within NYU Langone Health in collaboration with
leadership and staff as well as interdisciplinary teams.
The CTC is compared
to the “Control Tower” of the hospital. The team is doing on a daily basis
an amazing job to ensure the perfect management of all the bed’s
facilities in NYU.
Hospital Organization

NYU Langone owns 200 locations and 6 of them care for inpatients. The scope
of our project is limited to 3 of the inpatient units: Tisch Hospital,
Kimmel Pavilion & Hassenfeld Children’s Hospital.
Before going
further, we first need to define a nursing unit (NU). A NU is a physical
subdivision of the hospital. Each NU corresponds to a nurse desk.
Our project granularity is at a NU level: we need to forecast the availability within each of the NU.
The project scope counts around 562 beds distributed in 21 NU, each NU is also subdivided in 3 according to the different level of care: (from lowest to highest) Acute, Step Down & Intensive Care. The patients can, therefore, be allocated according to their service(Cardiology, Neurology, etc…) and the level of care they need. Usually, there are three to four NUs available, the placement is aiming to increase the operation efficiency of the hospital.
Hospital Patient Flow
In order to predict bed demand, it is important to understand the hospital patients flow. First of all, we need to create a simple scheme to understand in which state a certain patient can be. This scheme can then be easily modeled with Mathematics and be adjusted with the historical data.
The next figure illustrates the simplified mechanism of the hospital we chose for our study. The real diagram is more complicated but the changes that are induced are negligible in the scope of our project.
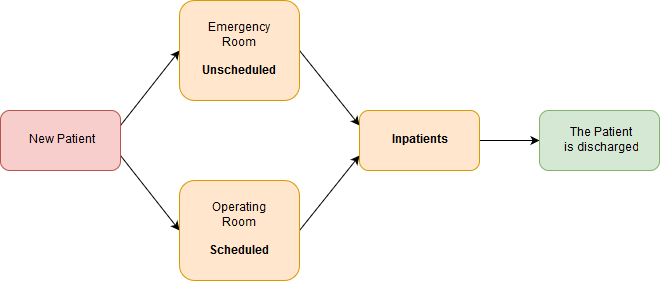 Diagram of the patients flow
There are two kinds of patients at the entrance: the scheduled (the ones that have an appointment at the hospital, mainly surgeries) and the unscheduled (mainly the emergencies). After being seen by the employees of the hospital, these patients can occupy or not a hospital bed and become inpatients until being discharged. Since the goal of the project is to predict the bed availability, the patients that do not occupy a bed are not taken into account.
In order to estimate the future bed availability, we need to separate the following cases:
- Current inpatients: We have access to a current snapshot of the inpatients, based on this data we wish to assign a particular Length of Stay (LoS) to each of the inpatients.
- Upcoming scheduled: We have access to the schedule of the next surgeries. We have some information on these “scheduled” patients. Based on this schedule, we will try to adjust the number of incoming scheduled inpatients and assign them a LoS.
- Upcoming unscheduled: By nature these patients are random. Based on historical data we will try to sample the upcoming arrivals in the Emergency Room. With these simulations, we wish to adjust the number of incoming unscheduled inpatients and assign them a LoS.
Model Framework
Input
Four dataset sources have been used:
- Current Census: It is a snapshot of all the inpatients in the hospital at the moment it has been pulled.
- Discharges: This is a dataset of the 2-last-months discharges, it is useful to make statistics on the historical data.
- OR Schedule: It is a schedule where we can access upcoming surgeries within 15 days, we have access to the intensity of the care, the type of medicine, and the hours of the surgeries. The NU is not assigned yet.
- Placement Matrix: This is a matrix often updated by the CTC team, associating particular a type of medicine and a level of care to a NU.
Output
The outputs are little tables for each nursing unit separated into three different sources: “scheduled”, “unscheduled” and “current inpatients” that can be easily aggregated. The columns of the tables separate six-time slots. Each time slot represents 12 hours (principally for morning and afternoon). The timeline is starting today at 0:00 AM and is ending after tomorrow at 12:00 PM. The rows of the tables separate the admissions, the discharges and the total number of patients in the NU (coming from the considered source) for each time slot.
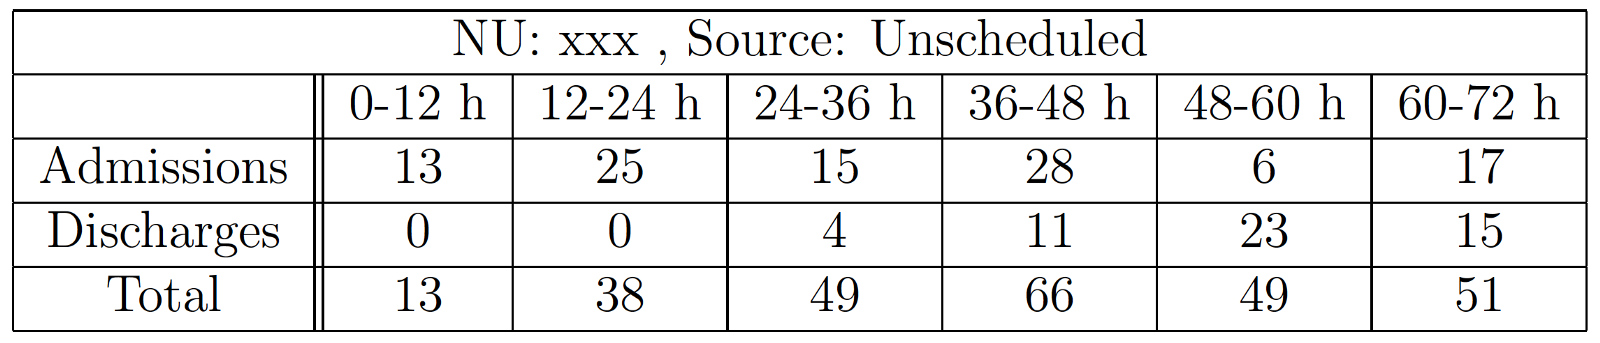 Example of an output for the unit xxx, sourced with the unscheduled patients
(the name of the unit is masked for non-disclosure agreement)
Example of an output for the unit xxx, sourced with the unscheduled patients
(the name of the unit is masked for non-disclosure agreement)
Aggregating the three sources
In order to have a prediction of the next 72 hours for a particular NU ignoring the source, we just have to sum the tables from the three sources. If we want the prediction for a complete location (Tisch Hospital, Kimmel Pavillon or Hassenfeld Children’s Hospital) we just have to sum the tables of the corresponding NU.
Conclusion
Et voila! In this first part, you had the opportunity to discover the hospital, CTC organization & management and an introduction to our model. In the coming articles, we will dig deeper into each part of the model, the use of word distance to make the program robust to human inputs, the simulation of unscheduled patients, the building of a Graphic User Interface and our reflection to improve our tool.
Please, follow us and stay tuned….