Leverage French Government Open Data to Make Savings on Gas Tank Filling
In this post, I will describe you how a conversation with my father lead to a small web-app he is now using on a weekly basis! - Originally published on Medium
Feel free to leave Comments and Claps!
And you can try the App here!

Leverage French Government Open Data to Make Savings on Gas Tank Filling
I am Selim Amrouni, currently a student in Operations Research at Columbia University. If you want to look deeper at the code of the project, you can go to my GitHub. Feel free to contact me by email or on my LinkedIn if you have any question.
In this post, I will describe you how a conversation with my father lead to a small web-app he is now using on a weekly basis!
Please, feel free to use the App. For now, it is only available for France but you can contact me if you want to make it available in your country.
Introduction
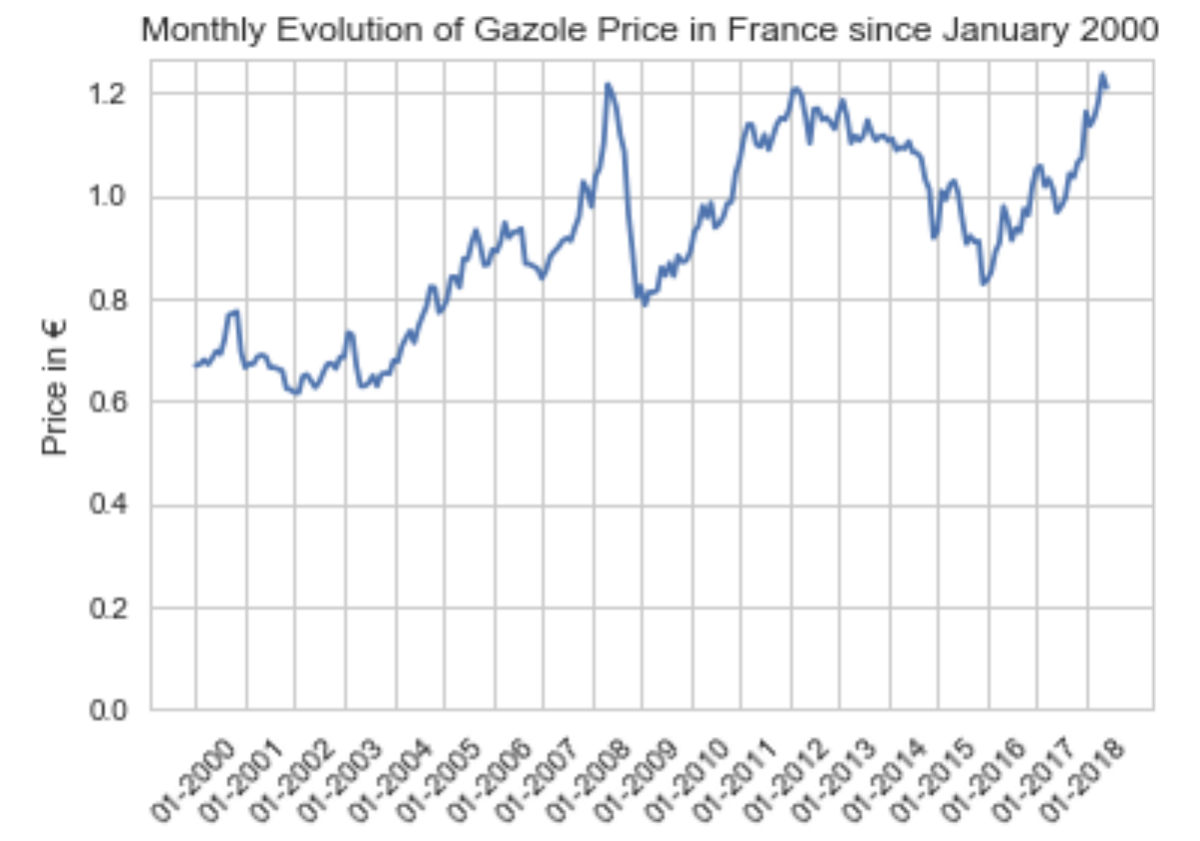 Gazole Price Evolution
Since my arrival in the USA, Gazole price has been constantly growing to reach its highest level ever… recently my father told me:
“You know Son, it’s always costing more and more at the gas station. Soon, I won’t be able to drive my favorite vintage car as much as I want.”
Here came-up the idea to build a tool for him and make him able to save some money on his gas tank filling-up! Indeed, the French government has its own open-data website with all French gas station information and especially 10-minutes updated price information.
This post is the retranscription of our back-and-forth discussion this summer while I was developing the tool which gives him in real-time the best gas station to go.
 Look how well he restored his vintage
4CV. He is really passionate, isn’t
he?
Look how well he restored his vintage
4CV. He is really passionate, isn’t
he?
Download & Filter the data
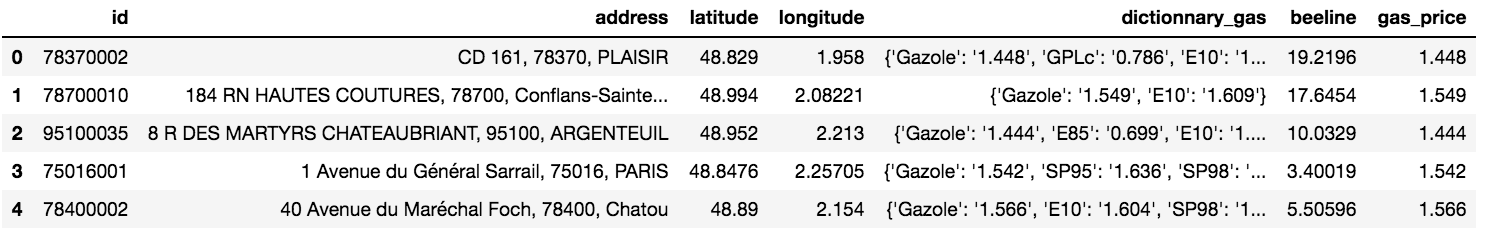
The dataset is directly downloadable and readable in an XML format. It is a widely used format which is readable by both a human and a machine.
Later, I will use Google Cloud API to compute distances. However, calling the API is not free and is slow. Then, it requires to filter first the stations which belong to our zone of interest. The Haversine formula is used to compute the straight line (beeline) distance between the driver starting point and the all the gas stations. Then, only the stations within this beeline(the maximum distance depends on the user preference) are kept for further analysis.
Compute cost of the filling
To get the number of Euros spent in the filling, I just have to multiply the needed amount of gas(in L — also depending on user preference) by the price of the gas(in €/L — the information is found in the scrapped data):
TotalCost = GasUnitPrice∗GasVolume
 Top 5 stations: Price of filling-up the tank
At this point, I thought I was done but…
“-So Dad, you can go to the first gas station on the list and you are going to save money!
-Well, well, well… Son, you just gave me the different prices and ordered them. Think about it, I’ll need to go there and come back from the gas station and it’ll cost me gas in driving. Can you think about it?”
Compute cost of the filling including distance
Ok, so my Dad is really perfectionist! How can I take the distance into account? I already computed the beeline distance… OK, but the roads are not straight lines, thus I need to get the real distance the car will cover. So, I can use the Google Maps API to compute the real distance between my dad and all the potential driving stations. For the selected gas station, I used the distancematrix API request to get the real shortest distance between Dad and gas station.
First, for the selected gas stations, I used the distancematrix API request to get the real-distance between Dad and gas stations.
Then, the cost of the filling-up is:
TotalCost = GasUnitPrice∗GasVolume + 2∗Distance∗CarGasConsumption
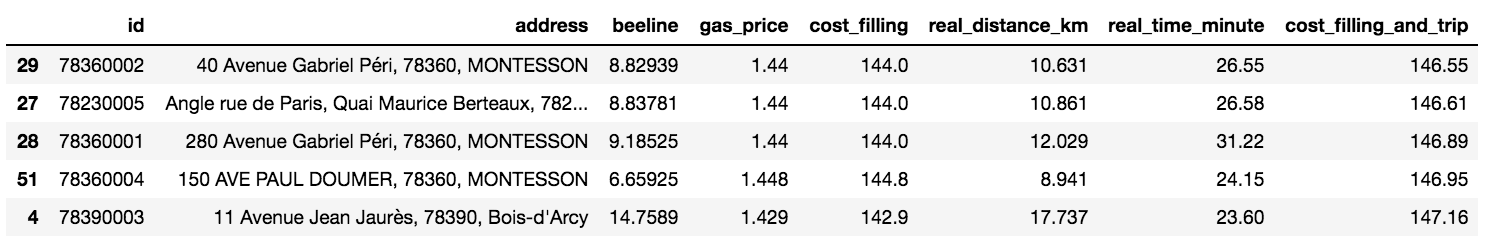 Top 5 stations: Price of filling-up the tank including the round-trip
Note: I count 2 times the ‘distance’ because I assume my Dad is doing a round trip to the gas station.
“Ok, Dad you’re right! It changed the order of the stations. Now I am done, you can go re-fill your car.”
Include cost of time
At this point, I thought we were done… But:
“Son, you know I am not that cheap! I can see I can save 1 € but it will take me 3 more minutes… My time is also valuable, and you want to send me so far away! I believe my time worths at least 0.5€ per minute. If I pay a small extra cost for time-saving, I’ll prefer this solution!”
This is how I came up with the time value cost. The idea is to compute the value of the time spent to drive to a new station. Thanks to that, I can compute ‘his personal cost’ to round-trip drive to the gas station.
The final cost of the filling-up is:
TotalCost = GasUnitPrice∗GasVolume + 2∗CarGasConsumption∗Distance + 2∗TimeValue∗DrivingTime
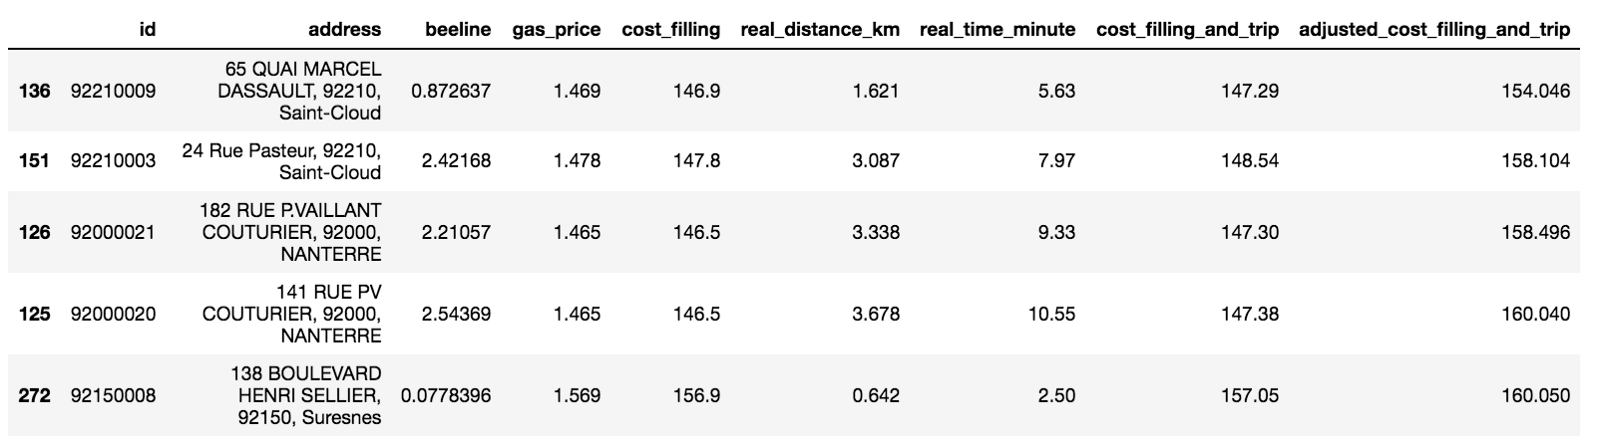 Top 5 stations: Price of filling-up the tank including the round-trip & time
value
Top 5 stations: Price of filling-up the tank including the round-trip & time
value
Note: Once again, I count 2 times the ‘distance’ and ‘time’ because I assume my Dad is doing a round trip to the gas station.
“Ok Dad, now I took into account the cost and the time, it’s finally done! And look, the formula is pretty smart, the optimal station(136) is neither the closest (272) nor the cheapest(126). This is really the optimal one given your parameters.”
Driving Road
“-Son… Actually, I have one more request… You gave me the name of the station but I don’t know how to go there…
-Ok, Dad, let’s see if I can figure it out.”
To do so, I used another amazing Google API features: direction. Then, I am able to give you the road directions to refill the car.
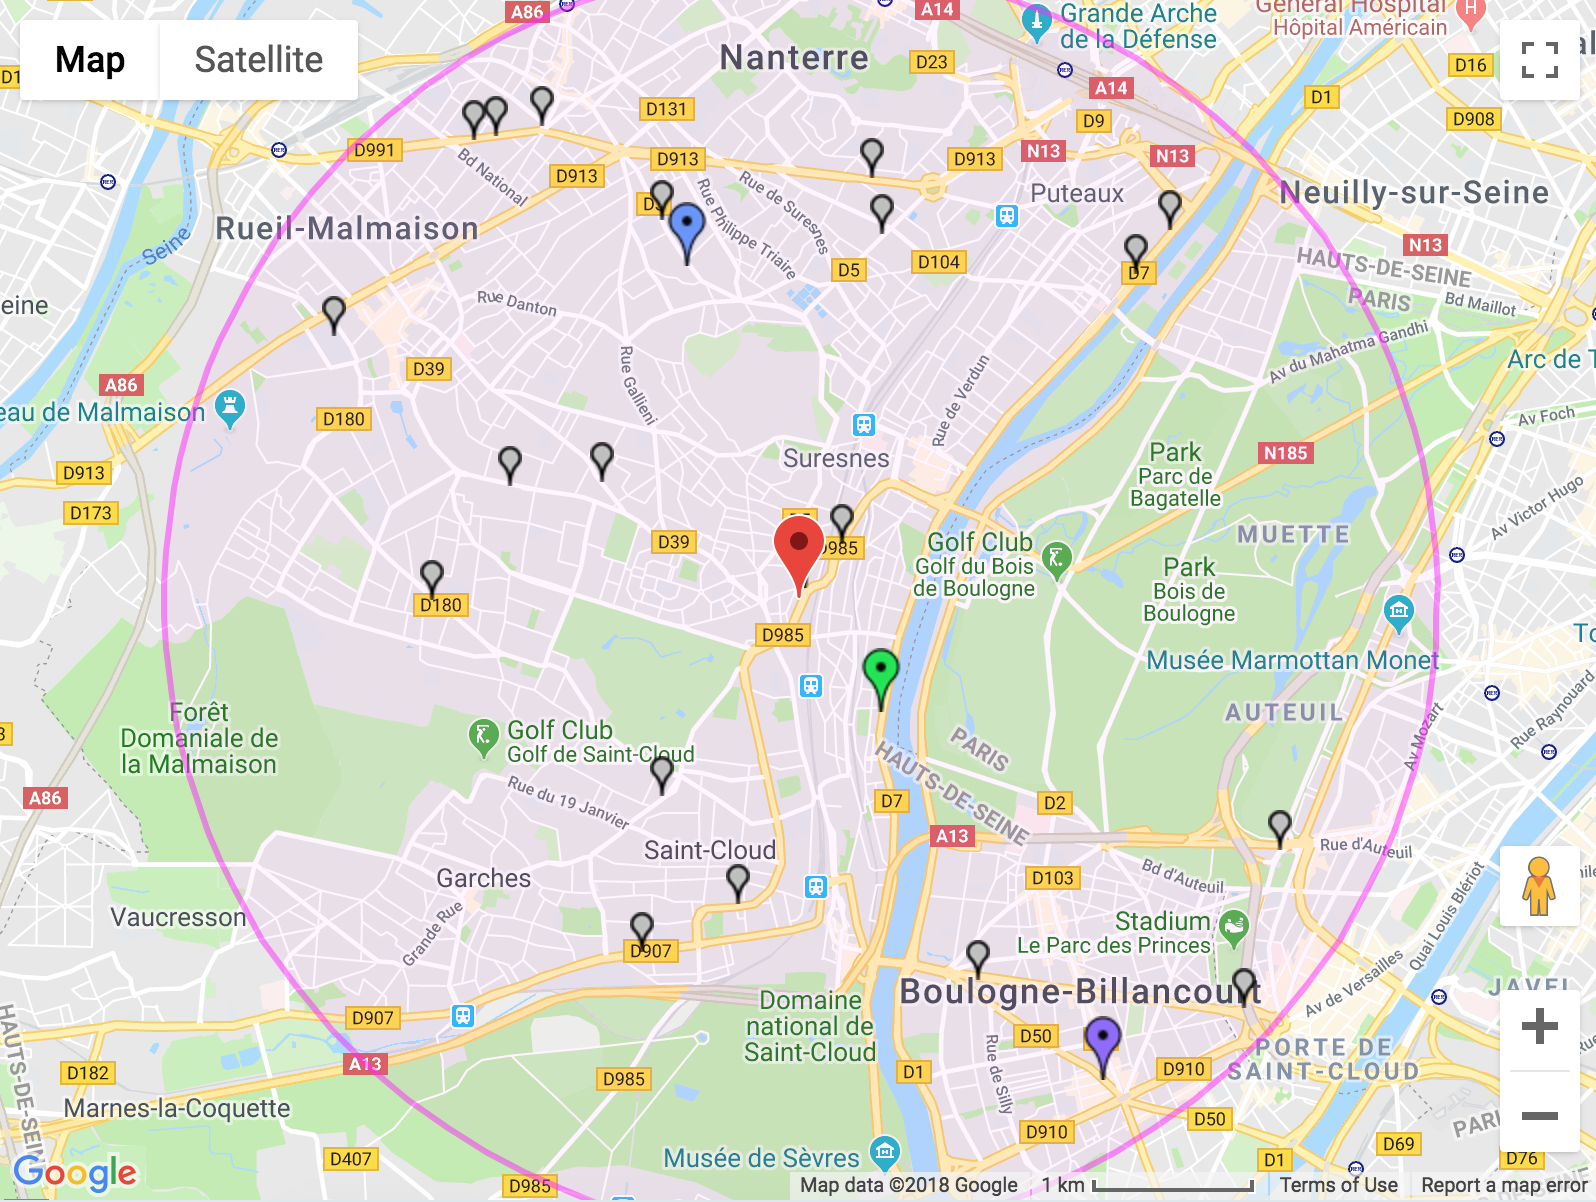 Gas Stations in within the maximum beeline distance. In blue the “Cheapest”, in
purple the “Most Expensive”, in Green the “Optimum”. You can’t see the yellow
one which represents the “Closest” because it’s overlapped with the home marker.
Gas Stations in within the maximum beeline distance. In blue the “Cheapest”, in
purple the “Most Expensive”, in Green the “Optimum”. You can’t see the yellow
one which represents the “Closest” because it’s overlapped with the home marker.
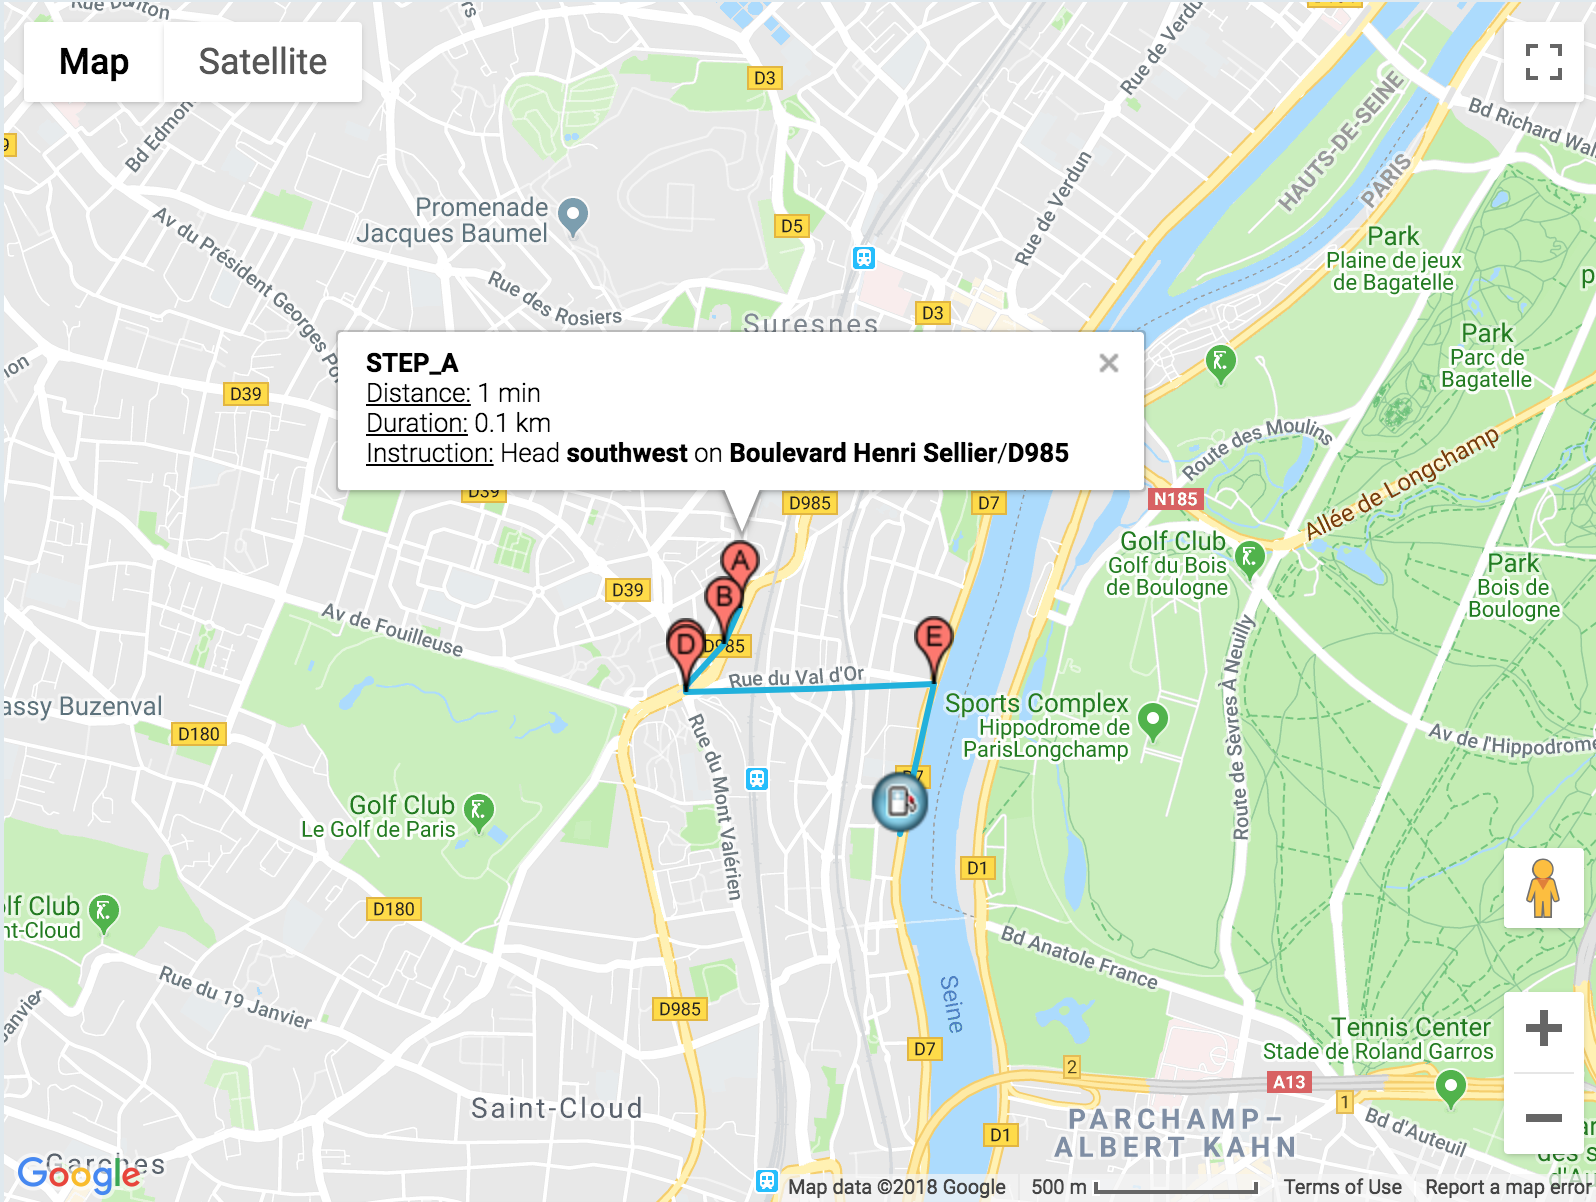 Direction to the Gas stations
Now, I was feeling the job was done. I just sent my father the notebook. However…
Web-App
“What is that stuff ?!? I don’t understand when I click on your file, it’s displaying a strange text”
This part has been the most time consuming. Fortunately, it was a real lesson on how the world is working. My Dad, just like so many people, was unable to use a raw Python file. I needed to create a GUI for him. Indeed, as a data scientist, the most important reward is to have an impact, and if I want to impact his life, I need to create tools he can easily use. I am facing the same problem during my internship where I need to work with CS and non-CS people. However, this is another story, I hope to tell you more about it later!
My first idea to create the Graphic interface was to use Tkinter which is the most used GUI in Python. However, I have been quickly limited by the fact Tkinter doesn’t allow us to visualize HTML maps on the screen.
I finally opted for developing a Web-App using the Flask Framework. I won’t go in details either on how to use Flask nor on how to host the app online using Heroku. (these links were amazing and did a great job in teaching me how to do that: link1, link2, link3, link4)
You can try the app, play with it and give your feedbacks! And please, as it is hosted on Heroku for free, it can be slightly slow at the launching. And please don’t select a too large max beeline if you look into big cities, indeed, Heroku limits the time of computation.
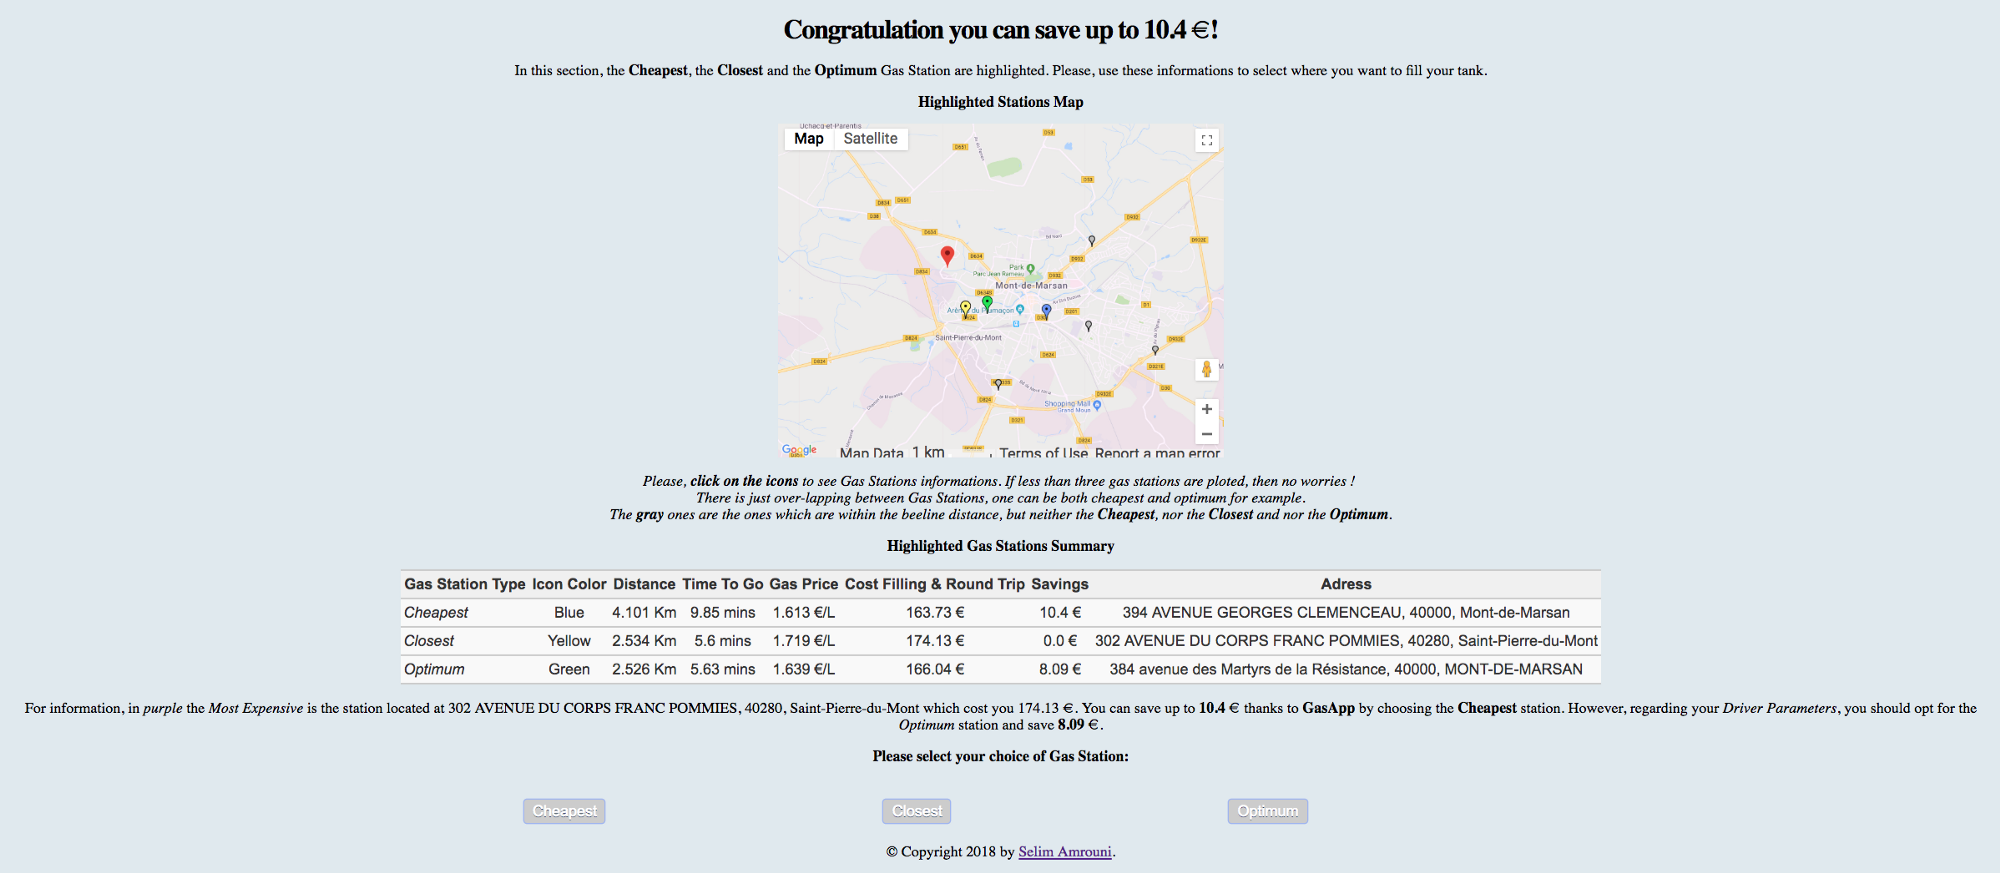 Yeah dad, you almost saved 10€ by choosing the good station in your area!
Last Words
“Thanks Son, well done! Enjoy your stay in the US and come whenever you want. Now, we can ride together the car in our wonderful *Aquitaine region.*